


Are you looking for the best heatmap software to optimize your web pages? It is crucial to analyze your web traffic to optimize your website for conversions and improve user experience.
Heatmaps can be a great tool to determine which areas of your website are most popular and need improvement.
This article compares the top heatmap software tools used to create heatmaps of your web pages to ensure they perform well.
What Is Heat Map Software

Heat map software allows you to see how your visitors interact with your website and mobile apps. It shows a visitor’s mouse movements and where they click. You can also use Heatmap tools to record user sessions and playback their actions.
The heat mapping software can determine what works and doesn’t on your website or app. It counts page views and displays how many clicks each button or link receives. This data can test new layouts on your site to increase engagement.
Heat map software’s ultimate goal is to keep your visitors on your website longer or drive them down a conversion funnel. Heatmap software can identify the dropout points in your funnel.
The best heat mapping tools are a massive benefit to eCommerce. Heat mapping tools are a great way to increase ROI. Any website can use Heat mapping to increase eyeball stickiness.
1. Session Recording
This tool captures a screen of the user visiting your site. The session can be viewed as a virtual movie with the mouse cursor acting as the main character.
This allows you to see how long people stay on your site. This also indicates frustration points, such as when someone repeatedly clicks (rage clicks) or their cursors start thrashing around.
2. Form and Error Analysis
Analytics show how users interact with signup pages or forms. It is helpful to see where users stumble or take their time. It also shows visitors where they change their minds and abandon the completed form.
For diagnosing and fixing bugs, error analytics is a great tool. You can see the activity leading to an error when a user receives it.
3. A/B Testing
Many heatmap tools allow you to do A/B testing. You can test two different versions of the same page and see which one is more engaging. It could be, for example, the color or position of a CTA button.
Editors are often included in heatmap software that allows A/B testing. Heatmap software that supports drag-and-drop is the best.
4. Zoho PageSense
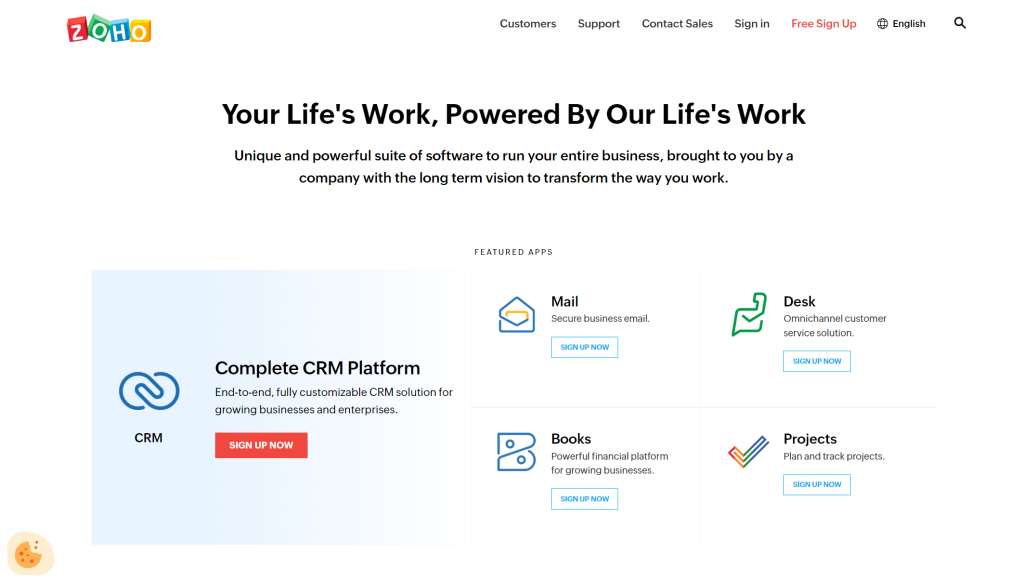
The Zoho page sense heatmap tool measures your website’s metrics and tracks visitor behavior to increase conversions. Its intuitive tools allow you to determine the scroll depth of page visitors and where they spend most of their time.
You can filter your reports using Zoho’s predefined segments or create your filter. Zoho’s basic package for small businesses includes a $17 monthly subscription and an analysis of 10,000 page views per month.
5. Lucky Orange
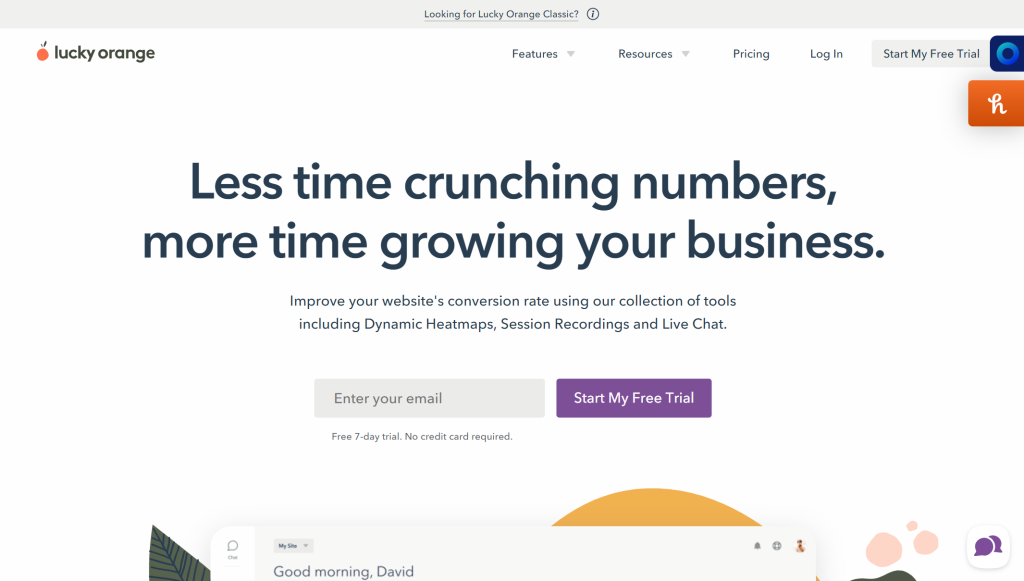
Lucky Orange offers heat maps, session recordings, and funnel analytics. It also has polls that allow users to share their behaviors. Your website activity includes clicks, taps, swipes, and scrolling.
Advanced segmentation and filtering capabilities are further supported to give you the feedback you need to plan your tests. The monthly cost is $10. The subscription includes unlimited recordings and 25,000 page views per month.
6. Quantum Metric
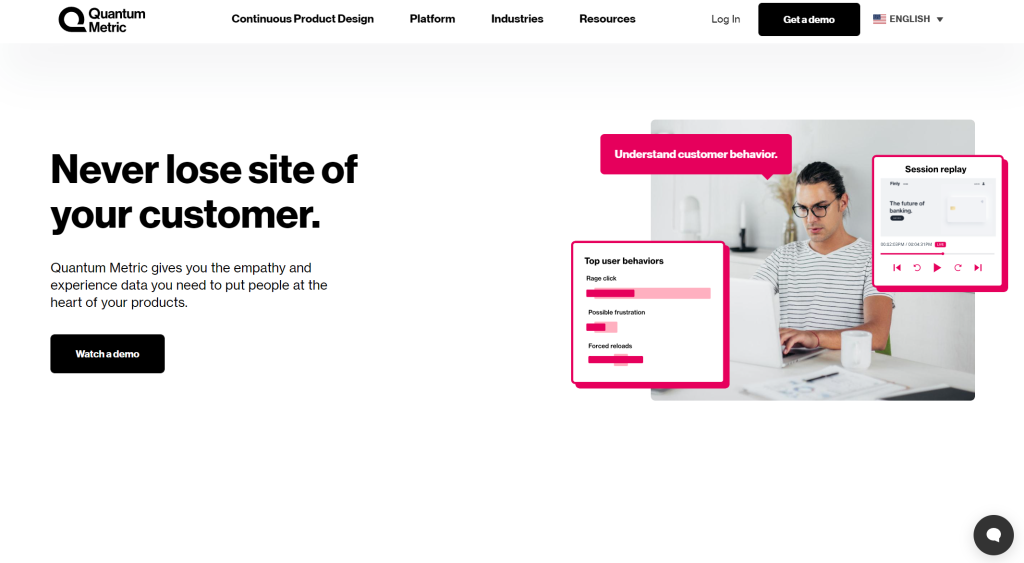
Quantum Metric provides a user behavior analytics solution using statistical analysis and machine learning to identify optimization opportunities on your website. This tool will allow you to optimize your conversion funnel, identify blockers, and highlight high-performing campaigns.
Businesses can use the real-time cross-team sync features to help them prioritize business impact opportunities and align with team-based dashboards. Quantum Metric offers custom quotes, and there is no fixed pricing information.
7. Crazy Egg
Crazy Egg, another website optimization tool, offers powerful heatmaps. You can use it to create heatmaps, scrolls, maps, and click reports to show how customers react to specific elements on your website. This tool eliminates all the guesswork and is easy to use.
Crazy Egg also offers A/B testing and session recordings. Crazy Egg’s A/B test results can be combined with insights from heatmaps and session recordings to understand the consequences better. This will allow you to decide what needs optimization.
8. Mouse Tracking and Confetti
Heatmaps can be static displays of your website or app interface. It displays the areas with the highest clicks using color coding. This is also known as confetti reports.
Red-hot is for many, while cold means few. Also known as tracking, heatmaps show mouse movements. These lines are drawn across your site.
9. Scroll Maps
In the same way, a scroll map uses color-coding to show where most people go on your page. It will be hot before the fold because everyone starts there. Please scroll down to see how fast it changes from red-hot to blue.
10. Mouse Flow
Mouse Flow was probably the first website optimization tool to be launched. With 165k+ customers, it has powerful features that can be used for website optimization.
The heatmaps from Mouse flow show where users click/touch, scroll, pay attention and move their mouse. It provides a visual representation of user behavior that is simple and easy to understand, allowing you to discover what works and what doesn’t.
Conversion Funnels and Forms, Session Replies, Conversion Funnels and Forms, and the feedback features in mouse flow help you understand how users use your site and where they leak out. You can also identify what is helping or hurting your conversions.
Conclusion
Your conversion funnel can be improved by using heat map tools. These tools provide valuable insights into the design features of your website.
It is easy to visualize data, and it helps anyone understand the subtleties of website visitor behavior. They provide insight into clicks and taps, scrolls, and mouse movements, allowing you to identify what is working and what isn’t.
Predictive heat mapping tools also come with many analytics tools that can be used to enhance your business intelligence. These tools allow you to monitor traffic sources, website problems, user interactions, event tracking, and the attractiveness of product pages.
Heatmaps are a great tool to improve conversion funnels on an e-commerce website in today’s competitive marketplace. You can now choose the heat map tools that best suit your business needs.

