Welcome to my Google Analytics guide! In this article you will read information, secrets, tricks on one of the most powerful web marketing tools. You will find out how to use Google Analytics to monitor professional sites, business sites and e-commerce. “Google Analytics: the complete guide” is designed for beginners but also for users a bit more experienced. So,… Google Analytics: the complete guide READ MORE
Welcome to my Google Analytics guide! In this article you will read information, secrets, tricks on one of the most powerful web marketing tools. You will find out how to use Google Analytics to monitor professional sites, business sites and e-commerce.
“Google Analytics: the complete guide” is designed for beginners but also for users a bit more experienced.
So, are you ready? Let’s find out how Google Analytics works!
What is Google Analytics for: the analysis of digital data
If you believe that Google Analytics only serves to monitor access to your website, you are wrong. GA is, first of all, a very powerful web marketing tool through which to analyze digital data , or the information deriving from your online strategies. The target? Simple: study the behavior of users of your site, check which channels or campaigns work, which are not and if necessary correct errors.
Google Analytics is therefore useful:
To publishers , to refine strategies for engaging their audiences;
To e-commerce owners or professionals , to understand which products or services they sell the most and through which channels;
To those involved in lead acquisition , to put potential sellers and leads in contact;
How to monitor a website: the Analytics code
Yes, ok – you will tell me – but how does Google Analytics work? GA. can monitor a website (but also an app) by installing a simple tracking code . This code is in JavaScript language and controls the entire website: as soon as a user visits a page, the code (or snippet ) anonymously collects the information and sends it to Google Analytics.
This is what the Analytics Global Site Tag (gtag.js) tracking code looks like
How to get the tracking code
Create your Analytics account!
To get this tracking code you need to create a Google Analytics account . As? Easy: follow these step by step instructions!
1) Log into your Google account (if you don’t have one, create it ); 2) Access the Google Analytics home page ; 3) Click on the “Register” button; 4) Set the name of your account, indicate the url of the website, the category to which it belongs and a time zone; 5) Click on the “Get Tracking ID” button at the bottom of the page, and the code will be yours!
How the tracking code works: reports and sessions
What information does the Analytics code collect? Data relating to traffic sources (search engines, social networks, etc.), browsers (language, type), device and operating system used , and much more.
Analytics groups this data into reports , i.e. reports on the use of the site that exploit different metrics (the device used, the country of origin, etc.). User activities, on the other hand, are organized in sessions . Be careful not to confuse a session with a page view:
A session begins when a user accesses a page containing the tracking code and ends after 30 minutes of inactivity (or “naturally” at the end of the day).
If the user returns to the page after the session ends, they start a new session.
Enter the tracking code on the site
It is possible to insert the Google Analytics tracking code on your site in three ways:
Manually , by copying and pasting the snippet in the website header (before the tag);
Through Google Tag Manager (an interesting option, which we will see soon in an ad hoc article!);
Through a plugin , if your site is made with a CMS (for example, WordPress );
A self-respecting Google Analytics guide cannot fail to provide an overview of the optimal organization and the constituent elements of this powerful tool. Before launching into the analysis of the reports, let’s find out how to best configure Analytics!
Accounts, properties, views
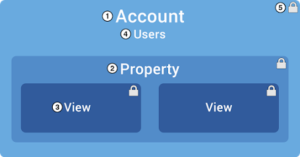
When you create an account, Google Analytics also automatically generates a property (the website you are monitoring) and, within the latter, a view (i.e. a set of rules for viewing data). One account can manage multiple properties: this means that if you are, for example, a web marketing professional and have many customers, with a single account you can access reports from multiple websites. Each property, in turn, can have multiple views.
The Account – Properties – Views hierarchy
What good is having multiple views? For example, you could use individual views to monitor specific areas of the site (in case you have a large site and need to monitor the various sections more thoroughly). Or to exclude from your reports the traffic generated by bots and spiders known to Google and perhaps also internal traffic (i.e. access to your or your employees’ site).
The latter case is perhaps the most frequent for small and medium-sized sites: let’s see how to proceed!
Set the base views
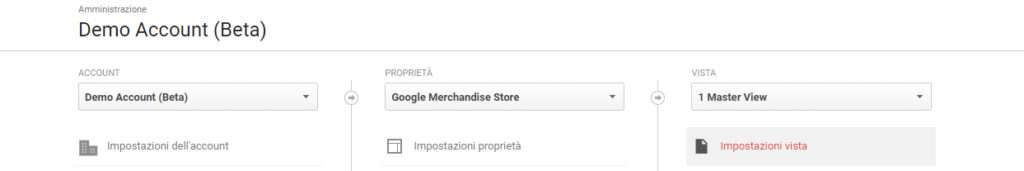
From the Google Analytics home screen, go to Administration > select the property you are interested in working on and, in the right column, click on “View settings” .
The basic view of Google Analytics is called “All website data” : rename it to “Raw data” and save. After that:
Click on the arrow at the top left and return to the Administration screen;
In the right column, click on the drop-down menu and select “Create a new view” ;
Give it the name “Test view”, select the correct country and time zone and click on “Create view” ;
Go to the “View settings” of the new view and check the box “Exclude all hits from known bots and spiders” ;
Save;
The test view settings
We need the test view to test the data and to make sure there are no errors in the data display. It will take a few hours before the “Test View” can collect the data. As soon as its correctness has been verified, select it in the “View” column and click on “View settings”. At the top right you have the “Copy view” button: give the new view the name “Main view” .
Now we need to apply a filter to the “Test View” to exclude the traffic generated by your IP .
From the “View” column menu go to Filters> Add Filters . Give the filter a name (eg “Internal traffic”); on “Select the type of filter” choose “Exclude” ; on “Select a source or destination” choose “IP address traffic” and on “Select an expression” select “Equal to” ;
Enter your IP address in the field below. You can get it from this tool: http://whatismyipaddress.com ; finally save;
Changing the filter
Again, wait a few hours to verify that the view is working correctly (you will find that it works if your reports show no traffic anomalies). After that, apply the filter to the main view as well. That’s how:
In the “View” column, select “Main view” and click on Filters> Add Filters> Apply Existing Filters : select the “Internal traffic” filter, which will be applied to the view.
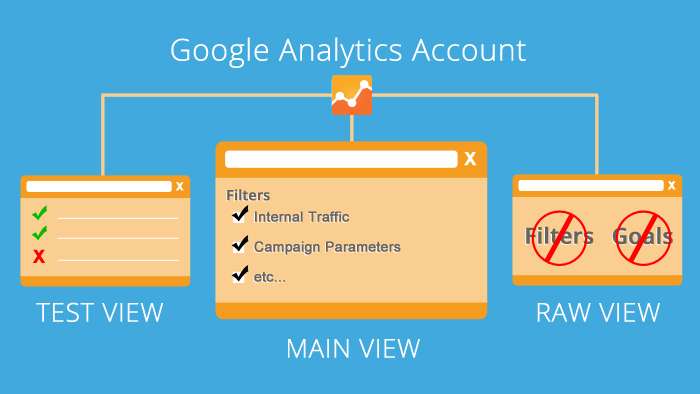
In this way you will have two views: a “raw” (“Raw data”, in fact) which will contain all the data, and a “filtered” (“Main view”) which will exclude internal traffic and that of known bots and spiders to Google. To put it in a graph:
A schema with the basic views of Google Analytics
To delete a view, just select it in the drop-down menu, click on “View settings” and from there on the button at the top right, “Move to trash”. The view will be permanently deleted from Google after 35 days.
NB: the filter for the exclusion of internal traffic only works if yours is a static IP.
User permissions
On the “Administration” page, you will notice that the Account, Properties and Views columns all have an option: “User Management” . It means that with Google Analytics you can share Accounts, Properties and Views , or give other users the possibility to access them.
Then click on the button, enter the email (obviously Gmail) of the user with whom you want to share the information and establish the permissions (if you want the user to only read or even make changes or maybe add other users in turn). Keep in mind that:
If you share an Account , whatever the functions you attribute to it, the user will be able to analyze the data of all the properties of that account (and obviously of the relative views);
If you share a Property , however, the user will have access to the data of only that Property (and its Views): they will not see the other Properties;
If you share a View , however, the user will be able to analyze only the data of the View in question , not the other views of that Property, the Property itself or the Account
How is Google Analytics done
Let’s start to warm up the engines: this section of “Google Analytics: the complete guide” shows you how the reports are structured, what the basic metrics are and how to organize the dashboards, to easily find all the data you want to keep an eye on!
The structure of reports: an overview
Google Analytics organizes data from user activity on your website into 5 reports:
In real time
Public
Acquisition
Behavior
Conversions
Each of these reports is based on different sets of metrics and are in turn divided into a variable number of reports, each relating to a specific dimension.
Audience reports provide information on users such as age and gender, geographic origin, etc. ;
Acquisition reports specify the channels, sources and means through which users arrive at your site ;
The Behavior reports indicate which pages are most viewed, which pages are to go to, to exit, etc. ;
Conversions reports provide valuable insights into the effectiveness of your campaigns ;
Real-time reports show the “live” situation of your site ;
The reports show data over a period of time which by default is set to the last seven days, but can be varied.
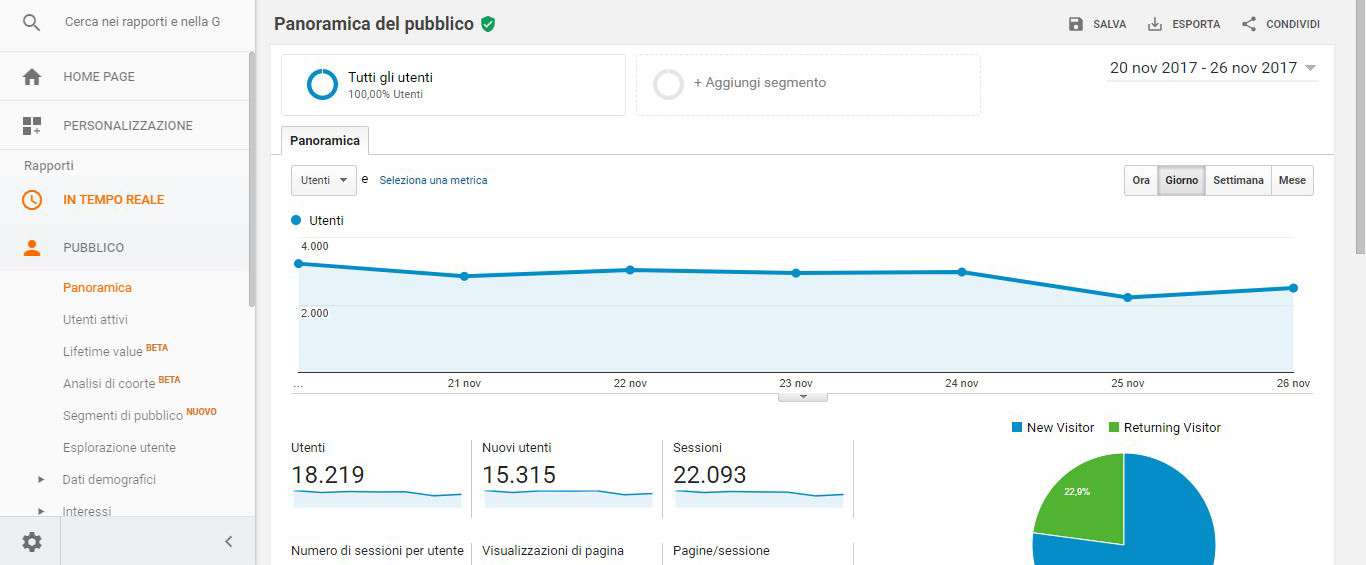
Each of the 5 basic reports has an “Overview” section (also present in many secondary reports): this is the one in which the contents of the report are summarized through the reference metrics.
The overview of Audience reports
In more specific reports, in addition to the initial chart, you will find information organized in tables. Consider, for example, the Location in Public> Geographic Data report : the table shows where your site visitors come from and the Acquisition , Behavior and Conversions metrics (we’ll see them very soon).
The “Location” report table: click to enlarge!
You need to know a few things about this table:
1) You can click on the data relating to the main metric (in this case, the countries) to deepen the data . You can also sort the data in the columns in ascending or descending order by simply clicking on the column header;
2) You can cross the “main dimension” (in this case, the location) with a “secondary dimension” , to have how the first varies as the second changes. For example, you can select “device category” as a secondary dimension to understand what type of device (pc, smartphone, tablet) the users who connect to your site from various locations use;
3) You can view the data not only in table format, but also with a pie chart, a performance chart, a comparison chart and with pivot mode : just click on the relative icons placed above the table, on the right;
The basic metrics
Before analyzing in detail the individual basic reports and discovering their peculiarities, to understand how to use Google Analytics to improve your online communication, you need to familiarize yourself with what are the most important metrics , i.e. those that appear in the Audience> Overview report. Here it is below:
Sessions : the total number of sessions in the considered time interval;
Users : the total number of visitors in a certain period of time;
Pageviews : The total number of times pages have been viewed by users. Attention, these are not “unique views”: the data includes repeated views of a single page by the same user;
Pages per session : the average number of pages viewed in a session (including repeated views of a page);
Average session duration : how long a session lasts on average;
Bounce Rate : Measures how many users left after viewing a page and took no further action.
The basic metrics at work!
How to share and edit reports
Earlier I told you that you can share Accounts, Properties and Views. Same thing for the individual reports , which can also be customized . Let’s see how!
At the top right, just below your avatar, you will find the “Save”, “Export”, “Share” and “Edit” buttons
Save, Export and Share buttons “class =” wp-image-7639 “srcset =” https://wpradar.com/wp-content/uploads/2017/11/salva-esporta-chare-report.jpg 396w, https://wpradar.com/wp-content/uploads/2017/11/salva-esporta-chare-report-300×87.jpg 300w “sizes =” (max-width: 396px) 100vw, 396px “/> Save, export and share your reports
“Save” : you can save the report, which will then be available in the Personalization> Saved reports section;
“Export” : you can export the report to your PC in PDF, CSV, XLSX (Excel) format or in a Google Drive sheet;
“Share” : you can send a copy of the report attached to an email message and schedule the regular sending of updates;
To create a custom report, instead, go to Personalization> Custom Reports> + New Custom Report . In this way, you can set the metrics you want, activate filters and views to your liking and also decide the layout of the screen. Would you like to know more? Read the Google Analytics guide on custom reports!
For each report, you can also change the sample rate of the report , i.e. reduce the amount of time Google collects the data: just hover over the green icon next to the report name.
But be careful: the choice is between “Faster response” and “Greater accuracy”!
The dashboards
Imagine that you are interested in a series of metrics that usually belong to different reports and want to check them periodically. How can you have them all in one place? Simple, just create a dashboard!
A dashboard is a flexible structure, a page in which to insert widgets that report the desired metrics. To create one, just go to Personalization> Dashboard> Create . You can choose whether to create a dashboard from scratch , starting from a blank sheet, or to use a preset dashboard (beginner dashboard).
Blank or preset dashboard?
Insert your first widget!
In the first case, the screen to insert the first widget will open immediately. As you can see, you can choose not only which metric to display, but also how (if as a timeline, geographic map, pie chart etc.); you can also view live data. Once you have added the first widget, you can add more thanks to the “+ Add widget” button immediately below the dashboard name, at the top left.
A preset dashboard. Beautiful isn’t it?
In the second case you have a dashboard full of widgets that you can delete (X), customize (click on the pencil icon) or move (by dragging the desired widget).
At the top right you will find two buttons: “Customize dashboard” allows you to change the layout (the number of columns on the page and their proportions), “Delete dashboard” deletes it.
Dashboards can also be shared: immediately under the name of the dashboard, next to the “+ Add widget” button, you will also find the items “Share” , “Email” and “Export” . The first button allows you to share the dashboard in the form of a url ( “Share link to model” ), for all users of a view ( “Share object” ) or in the Analytics solutions gallery . “Email” sends the PDF version of the dashboard via email , while “Export” downloads the PDF to your computer.
Public relations
The Audience section of Google Analytics contains a series of reports useful for providing an identikit of visitors to your website : age, gender, the countries they live in, the language they speak, the devices and operating systems they use to connect and even the their interests.
The main relationships are:
Active Users Report
Reports Demographics and Interests
Geographic data reports
Behavior reports
Technology and Mobile Device Reports
The Active Users report
The Active Users report
The “Active Users” report shows users who have had at least one session on the site in the last day, in the last 7, 14 or 30 days . In other words, this report allows you to measure “site coverage” or “attractiveness” . Are the marketing strategies your site envisions to keep users coming back working? With the “Active Users” report you can find out!
Reports Demographics and Interests
The Demographics reports
The Demographics and Interests reports are probably among the most consulted among Google Analytics users.
The former allow you to trace a demographic profile of the users of the site , since they provide information on age and gender; the latter indicate user preferences for certain types of content : the data are grouped by “Affinity category” , “In-market segment” and “Other categories”
Interests reports
How can this data be useful to you?
– If you know all the information about your site’s audience, you can understand if you are aiming for the right target or not; – You can implement more effective (and profitable) marketing and content marketing strategies, for example by targeting a certain segment, age group or geographical area.
Important: Data from the Demographics and Interests reports are not available by default. For the property you are interested in analyzing, you must activate the “Enable Demographics and Interests reports” option in Administration> Properties> Property Settings . Once the function is activated, you will need to give Analytics 24 or 48 hours to collect the data ( as long as the site is large enough to allow it ).
Geographic Data Report
The Location report
Among the most useful reports of Google Analytics there is certainly the report Location in Geographic data . By consulting it you will be able to find out from which continent, country or city users are watching you. Tracking takes place (anonymously) through IP addresses. The report presents the classic table that allows you to cross-reference data of geographical origin with parameters such as “Sessions”, “% new sessions”, “New users”, “Bounce rate”, “Pages / session”, “Average session duration” etc.
The Languages report
The Languages report , on the other hand, shows which language your site visitors use (or rather: which language they have set as that of their browser). The utility? If you have a multilingual site (because you offer your product / service in multiple countries) you can try to understand which markets work best, which ones are expanding or, vice versa, the geographical areas in which you are most in difficulty. All invaluable information when it comes to setting up a business strategy!
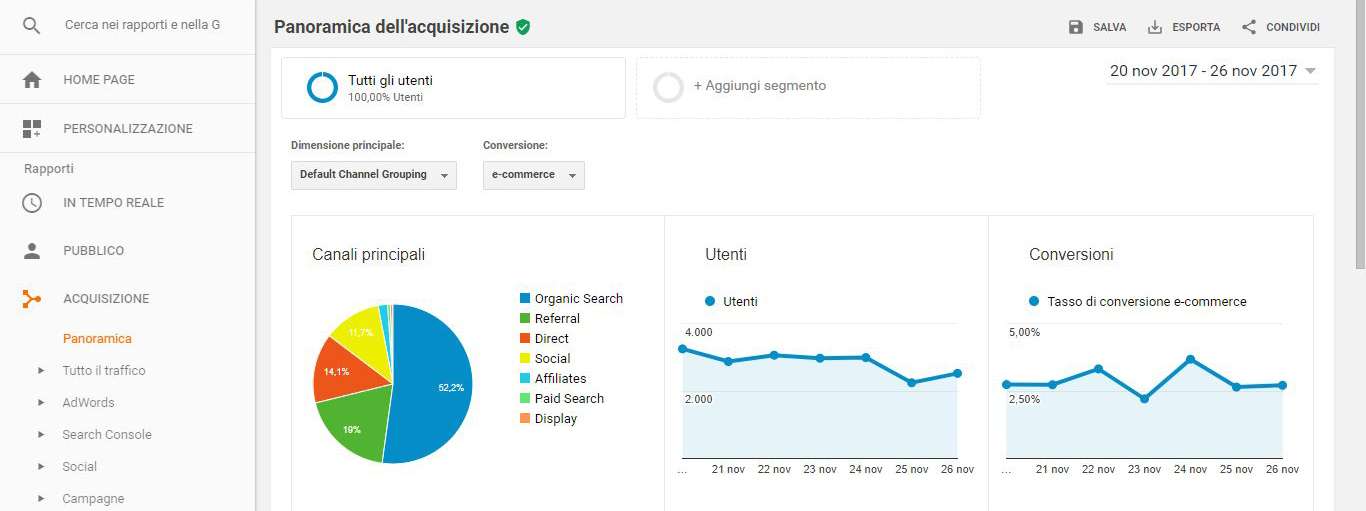
The Acquisition reports
A Google Analytics guide can’t miss the Acquisition reports . It is, in fact, a very powerful and extremely important tool for verifying the effectiveness of multi-channel communication . What does it mean? It means that with the data contained in these reports you can understand what are the traffic sources to your site and measure their performance , in terms of accesses or – we will see later – of objectives .
Which channels bring the most traffic to your site?
Means and sources
Before examining in detail the main reports, we need to clarify the concepts of Medium and Source , two fundamental indicators.
Means are the mechanisms that lead users to visit your site . They are divided into:
Organic : the traffic arrived on your site through the free search on engines ;
CPC : acronym for Cost per Click , indicates the traffic generated by a paid campaign on search engines ( AdWords );
Referral : traffic from a link to your site on another site (other than a search engine);
Email : users who landed on the site through an email marketing campaign ;
(none) : this indicates the users who have arrived at the site by directly typing the URL in the address bar ;
A medium can have different sources. For example, if the medium is “organic”, the source can be Google, Bing, Yandex etc .; or if the medium is “referral”, the source is the url that led users to your site.
The Channels report
The Channels report
In Acquisition> All Traffic> Channels we can measure the traffic coming from different channels . What is a channel ? It is a sort of label with which Google goes beyond the concept of medium and groups together various traffic sources . For example. the “social” channel can have sources such as Facebook, Twitter, Linkedin.
To discover the sources of a channel, just click on them in the table that appears in the second half of the page. More information on the concept of channel can be found at this link .
The Referral Report
What links bring you traffic?
Still in Acquisition> All Traffic you can find the Referral report . It allows you to understand which other sites bring users to yours thanks to the presence of links.
You can deepen your analysis by clicking on the individual sources: in this way you will accurately identify the URLs through which you receive traffic . Do you want to detect landing pages too ? Simple: just add “Landing page” as a secondary dimension, and that’s it: you will have more information to establish any partnerships with the websites that link you.
If you want to know how to get many external links to your website and also why this is essential to improve your online ranking, read my SEO guide!
Search Console reports
Google Analytics integrates perfectly with another fundamental web marketing tool offered (for free) by Google: Google Search Console . This is the first and most important SEO audit tool: Search Console, in fact, allows you to detect errors that risk making your site less visible , to analyze the queries (i.e. search phrases) with which users find you on the web , landing pages and much more.
Integrating Search Console with Analytics is therefore an indispensable move to have all the relevant information for your marketing strategy in a single location.
Google Search Console data in Analytics!
How to connect Search Console with Analytics? Easy: Go to Administration> Property Settings and, in the section dedicated to Search Console, locate the corresponding property. (Don’t have your Search Console account yet? Learn how to create and configure it here!)
This way, the Search Console report will show you landing pages, countries, devices, and search queries that users use to get to your site.
The Behavior Reports
Do you want to understand how users interact with your site? Take a look at the Behavior reports – you’ll find all the information about page views, average time spent on them, bounce rate and more. Perhaps the most interesting element of this category of reports concerns the flow of behavior : let’s analyze it now!
The Flow of Behavior
Can you tell how users behave once they land on your website? Which pages do they browse, which do they leave, and which paths? All these questions are answered by a report called “Behavior Flow”.
The Flow of Behavior
This report consists of a flowchart that highlights the nodes , connections and exits that together form the traffic flows.
The nodes are the points of passage of traffic , and are marked in green . By clicking on them it is possible to highlight the traffic that passes through them and obtain a detail on the group (the pages grouped in that node);
The connection is the path between one node and another as well as the volume of traffic generated ;
The exit is the point where the user leaves the stream .
Analyzing the flow of behavior provides interesting insights. The fact that, for example, that users always leave the flow in the same place can indicate critical issues that, if resolved, improve the user experience and conversions.
The Site Content reports
The contents of the site
Users’ relationship with your site’s content is covered by the Site Content report. In the All pages section you will find, for each page of your site, very useful information on: total pageviews, unique views (in how many sessions that page was viewed at least once), accesses (how many sessions started from that page) certain page), the percentage of exits and the bounce rate .
The pages are displayed by default based on the URI (the part of the url that appears after the domain name), but it is possible to set the main dimension to “Page title” to display the title of each content as indicated in the source code.
The other reports
Behavior reports contain a lot of useful information to understand how your site is navigated. As this Google Analytics guide is “basic”, we won’t go through them all in detail. However, here is the brief description:
Contents details (in Site Contents) groups the pages by directory : it is a useful way (especially if the display of the graph is set on the “pie”) to check which sections of the site are most visited.
Landing pages (under Site Content) displays the pages from which visitors entered your site (so-called “landing page”).
Exit Pages indicates the pages from which users have left the site . Pay attention to this report, especially if you have an e-commerce: the fact that – for example – many users leave the site from the purchase payment page could indicate some critical issue, to be corrected to maximize results.
Events is a report that allows you to monitor specific events (eg clicks on a video player or downloads). To monitor these elements you have to perform a series of options perfectly described in the official Analytics Guide: https://support.google.com/analytics/answer/1033068?hl=it .
What kind of Google Analytics guide would this be if I didn’t talk to you about how to track campaigns , define goals and measure the success of your AdWords ads ? Analytics is in fact above all a marketing tool, and therefore these functions enhance its characteristics and usefulness.
Before diving into this new section, let’s clarify the term “conversion” . Conversion does not (only) mean “purchase”: in the jargon of web marketing this word indicates any action performed by the user that is relevant to your business . So if your site is a t-shirt e-commerce, the conversion will (also) coincide with the purchase of a t-shirt; but if yours is a web marketing blog and your goal is to grow your mailing list, every new subscription will also convert. (So, to go back to the e-commerce example: if you have a section dedicated to the newsletter and you launch a campaign to get new subscribers to propose exclusive promotions, conversions will also be the new subscriptions).
Well, now let’s see how …
Monitor a web marketing campaign
Web marketing campaigns can be carried out with different tools. For example, social mediaadvertising, text ads on search engines , paid banners on other sites , emails . It doesn’t matter which channel you choose; the important thing is that it is appropriate to the target and the result you want to achieve and, above all, that it is traceable.
And what web marketing campaigns have you activated?
Monitoring a web marketing campaign with Google Analytics is the best way to obtain the data that allow you to understand if the strategy worked, where, why, on which audience, medium or source, etc.
Analytics tracks campaigns through the use of internal tags. What are these tags? They are pieces of information that you add to your landing page URLs. When users click on these pages (for example because they are links promoted on Facebook or inserted in the text of a newsletter), the tracking code collects the data and sends them in specific reports.
This way, nothing of your campaigns will escape you!
Campaign tags: the URL Builder
Yes, but how are these tags made? And how can I insert them in the url?
First, let’s define them. There are 5 campaign tags and they refer to specific information:
Medium : the technology used (email, cpc, social media, etc.);
Source : the origin of the user depending on the medium (eg. If the medium is a paid campaign on search engines, sources can be Google, Bing, Yahoo etc.);
Campaign : the name of the marketing campaign (eg “Promo summer 2017”);
Content : thanks to this tag, it is possible to differentiate the versions of the same promotion;
Term : the keyword used for paid search campaigns;
The values of these tags are up to you. As? Through the URL Builder , available in the Google Help Center.
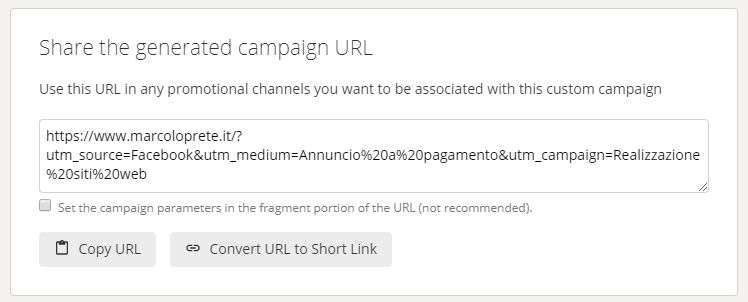
Here’s how to use the URL Builder
This tool allows you to establish tag-by-tag values and, above all, to obtain the url duly modified and therefore ready to activate the Analytics reports. This is the url you will need to use in your campaigns!
The URL to share!
Monitoring of active campaigns
But be careful: before proceeding with the campaign, test the link! It may happen, in fact, that a particular configuration of your site can block the functioning of these tags. Immediately after creating the custom url, paste it in the address bar of your browser in incognito mode and browse the site. If you’ve set goals (we’ll see how later), take one of the relevant actions as well. After a few hours, in the Acquisition> Campaigns> All campaigns section you can check that the campaign is actually active.
Goals in Google Analytics
So far we have seen how to monitor campaigns. But the conversions? How to track them accurately? How to measure the value they produce? Through the Goals feature!
For each goal, you will be able to see the total conversions and the conversion rate , which is the percentage of users who have taken that action. Not only that: you can also set up a “goal funnel” , which is an ideal path that will help you understand where users abandon the conversion process.
Create a goal
You can create a goal in Administration> View> Goals . You can only do this if you are the view administrator. You can create up to 20 goals.
Preset or custom goal?
By clicking on “New Goal” , you can choose between a series of preset goals or a custom goal.
Analytics provides some predefined business goal templates, but you can also create a custom goal. Suppose you are tracking contact requests for a form. We then select “Custom”.
In the next screen we are led to assign a name to the objective (eg “Home quote requests” if we want to monitor a form on the home page). “Goal area ID” is a numerical identifier to be associated with the goal, between 1 and 20. Goals are grouped into 4 sets of goals. Goal sets help distinguish goals based on common characteristics (e.g. all completed forms, all downloads, all purchases, etc.)
We then select the type of lens. We distinguish between:
Destination : reaching a certain page of the site;
Duration : a certain duration of a user’s session;
Pages / screens per session : a certain number of pages viewed by a user in a session;
Events : a specific action;
Landing page, value and funnel
In our case, we select “Destination” . Because? Because if our goal is to fill out a form, a quick way to measure it is to monitor how many people reach the thank you page that is activated after pressing the “Send message” button. Attention, however: if there are different forms on the site, and my intention is to trace them all, it is important that each one has a distinct thank you page , that is with a specific url.
By clicking on “Continue” we access the “Objective details” . In the “Destination” field, we select “equal to” and insert the URI of the thank you page (eg /thankyou1.html). If we want to set a value for each conversion , we activate the relative switch. For example, I can establish that each completed form is worth 1 euro; in the case of the sale of a product, in this field I will enter the net profit that the sale gives me.
The channeling
To monitor a specific funnel, I activate its switch and enter the path nodes, each identified by a name and the page URI. If you set the first step as “mandatory”, the “Funnel View” ( Conversion> Goals> Funnel View ) will only track those starting from that point.
Before saving the goal, I always recommend that you check it: Google Analytics will display how often the goal could have been converted in the last 7 days.
Now that the goal has been created, you’ll need to wait a few hours for Analytics to show you the reports. Goal metrics will be available in the Conversions> Goals> Overview reports. Data on goals will also be available in other reports (e.g. Public or Acquisition).
Google AdWords ad tracking
AdWords is Google’s platform for creating advertisements. These can be of two types: text or display . Text ads appear in Google search results when a user types in a certain keyword (or query); Display ads, on the other hand, consist of text, images, animation or video and appear within a series of sites that make up the Big G Display Network.
Linking Analytics to your AdWords account is a smart choice, because it allows you to analyze the engagement generated by your ads and tie it to other metrics (e.g. goals). How to do? Just go to Administration> Properties> AdWords Linking , and that’s it.
Automatic coding
Remember the URL Builder we talked about earlier? Well, in the case of AdWords it’s not necessary. This platform, in fact, can automatically add campaign tags to the destination URL via the auto-tagging feature.
This function allows you to add a series of information:
Query Match Type : Shows how a match between an AdWords keyword and a user’s search query is found;
Ad group: Shows the ad group associated with the keyword / creative and the click;
Destination URL : Shows the AdWords destination URL configured in AdWords ads;
Ad format : indicates whether the ad is text, display or video;
Ad distribution network : shows the network used to serve the ad;
Positioning domain : it is the domain on the Display Network in which the ad was published;
AdWords Customer ID : This is the unique ID assigned to your AdWords account;
By analyzing this data in the Acquisition> AdWords reports, you can improve campaign performance by comparing, for example, the results of different formats or by analyzing the various keywords.
In particular, keep an eye on the reports:
Campaigns , useful for calculating the performance of active campaigns, which will be organized using the same names assigned in AdWords;
Keywords , which shows the performance of keywords and keywords. Thanks to metrics such as bounce rate or conversion rate, you can significantly improve the performance of your campaign;
Conclusions: why you can’t not have Google Analytics
At this point in my guide to Google Analytics, you should no longer have any doubts as to why this is a fundamental marketing tool. A single tool that allows you to:
monitor access to your site;
draw an identikit of your visitors;
understand from which channels they access your site and how they navigate it;
check the trend of the user flow;
track active campaigns and verify their effectiveness;
really can’t miss in your toolbox!
I hope “Google Analytics: The Complete Guide” was as interesting and stimulating for you to read as it was for me to write. If you like, leave a vote!